Finding the percolation threshold
Problem: You’re interested in percolation processes, possibly inspired by the link to SIR epidemics [New02]. You want to find the percolation threshold for a network.
Solution: The Newman-Ziff algorithm [NZ00] is the tool for the job. It explores the percolation properties of a network for all values of the percolation probability \(\phi\).
There are two versions of percolation. In bond percolation the edges
are occupied, and the connected component is formed of those nodes
that the edges connect; in site percolation the nodes are occupied,
and the connected component is formed from all those occupied nodes
that have edges between them. epydemic hass two classes,
BondPercolation and SitePercolation, encoding each
approach. Newman [New02] uses bond percolation
to study epidemics.
Let’s study bond percolation on an ER network. The theory of percolation suggests that the GCC typically forms suddenly at some critical percolation threshold \(\phi_c\). Let’s use the Newman-Ziff algorithm to check this. We create a network and run the bond percolation process across it. This adds edges one at a time and computes the size of the largest connected component. We expect that, at some value of \(\phi\), the size of this component will increase very rapidly.
We first create the network:
from epydemic import BondPercolation, ERNetwork
from epyc import Experiment

N = 10000
kmean = 20

params = dict()
params[ERNetwork.N] = N
params[ERNetwork.KMEAN] = kmean

g_er = ERNetwork().set(params).generate()
We can then run the bind percolation process on this network:
e_er = BondPercolation(g_er)
rc_er = e_er.set(params).run()
This gives us a result set containing two time series, for the occupation probability and the size of the largest connected component. We can plot these two against each other:
import matplotlib.pyplot as plt

fig = plt.figure(figsize=(5, 5))
xs = rc_er[Experiment.RESULTS][BondPercolation.P]
ys = [gcc / N for gcc in rc_er[Experiment.RESULTS][BondPercolation.GCC]]
plt.plot(xs, ys, 'g-')

plt.xlabel('fraction of occupied bonds $\phi$')
plt.ylabel('size of giant component $S$')
plt.title(f'Bond percolation on ER network ($N = {N}, \\langle k \\rangle = {kmean}$)', size='medium')
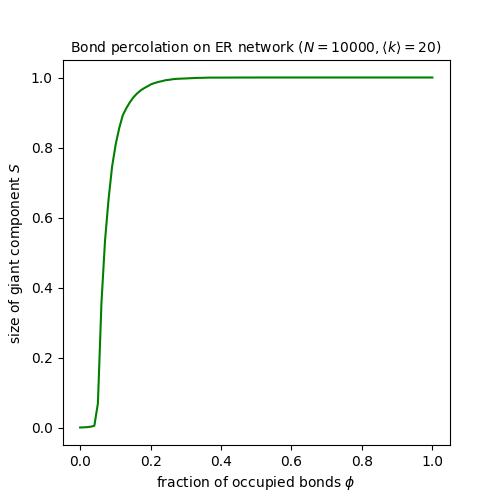
This very clearly shows the transition: below a critical value the largest component is essentially small; above that value, it is essentially all the network; and there’s a very narrow band of values in which it takes other non-extreme sizes.
The theory of percolation, incidentally, says that the percolation threshold occurs at a value \(\phi_c = \frac{1}{\langle k \rangle}\) [MR96], which looks to correspond with the results of our experiment.