Monitoring the progress of a simulation
Problem: You want to observe how a process evolves over time, capturing a time series of some property of interest. Then you can use this time series as well as the result at equilibrium (the end of the simulation) to draw conclusions.
Solution: Essentially the problem here is to capture the ongoing state of the network as the process runs. The most common scenario is that you want to examine how things change so that you can plot a graph of them, and for this the easiest approach is to post a repeating event that captures the data you’re interested in at some interval.
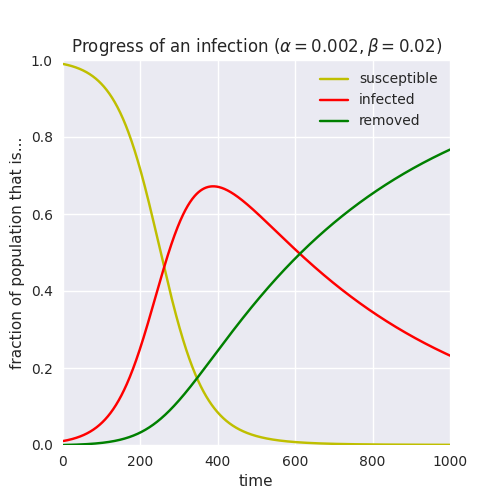
Suppose for the sake of argument that we are wanting to verify that an SIR process over a network behaves similarly to the same process in a continuous domain. The continuous version, described by differential equations, might look like the following:
We need to run an SIR simulation and at the same time extract the sizes of its components, not simply wait until equilibrium as is the default. In other words, we need to add monitoring code that will extract this information as the simulation progresses.
We can observe that there are two processes here – SIR and observation – which are essentially
independent: the events observing the progress of the epidemic aren’t affected by the epidemic
itself. epydemic includes a Monitor class that provides regular monitoring,
so we can simply compose SIR and Monitor together to form a sequential process.
The Monitor class records the sizes of loci. SIR has loci for infected
nodes and susceptible-infected edges: if we want to capture the other compartments, we need
to create loci for them too. The resulting class is:
from epydemic import SIR, ProcessSequence, Monitor, ERNetwork, StochasticDynamics
from epyc import Experiment

class MonitoredSIR(SIR):

    def __init__(self):
        super().__init__()

    def build(self, params):
        '''Build the process, adding additional loci
        to be monitored.

        :param params: the parameters'''
        super().build(params)

        # add loci for the other compartments
        self.trackNodesInCompartment(SIR.SUSCEPTIBLE)
        self.trackNodesInCompartment(SIR.REMOVED)
We can then use epydemic to run this process using the same parameters as we used for the
continuous-domain experiment:
params = dict()

# use an ER network as the substrate
params[ERNetwork.N] = 10000
params[ERNetwork.KMEAN] = 3

# set the parameters the same as above
params[SIR.P_INFECT] = 0.02    # infection probability
params[SIR.P_REMOVE] = 0.002   # recovery probability
params[SIR.P_INFECTED] = 0.01  # initial fraction infected

# capture every 10 timesteps
params[Monitor.DELTA] = 10

# build a compund process from the disease and the monitor
p = ProcessSequence([MonitoredSIR(), Monitor()])

# run the compound process
e = StochasticDynamics(p, g=ERNetwork())
e.process().setMaximumTime(1000)
rc = e.set(params).run()
We extract the time series from the results, which are composed of
four parts: one for the times at which the observations were made (
Monitor.OBSERVATIONS); and then one each for the loci whose
sizes we recorded, whose names are constructed using
Monitor.timeSeriesForLocus().
res = rc[Experiment.RESULTS]
ts = res[Monitor.OBSERVATIONS]
er_sss = list(map(lambda v: v / N, res[Monitor.timeSeriesForLocus(epydemic.SIR.SUSCEPTIBLE)]))
er_iis = list(map(lambda v: v / N, res[Monitor.timeSeriesForLocus(epydemic.SIR.INFECTED)]))
er_rrs = list(map(lambda v: v / N, res[Monitor.timeSeriesForLocus(epydemic.SIR.REMOVED)]))
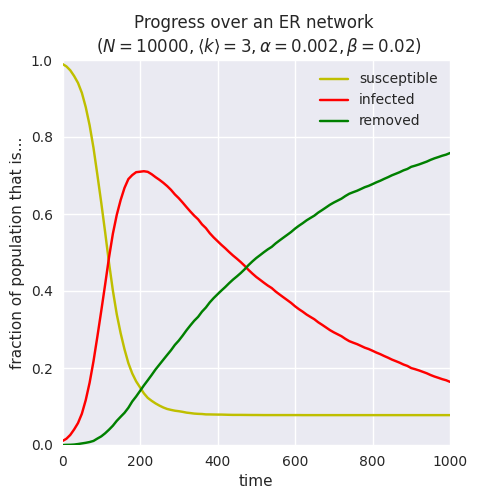
Plotting the results is the straightforward:
fig = plt.figure(figsize=(5, 5))
ax = fig.gca()
plt.title(f'Progress over an ER network \n $(N = {N}, \\langle k \\rangle = {kmean}, \\alpha = {pRecover}, \\beta = {pInfect})$')
plt.xlabel('time')
ax.set_xlim([0, T])
plt.ylabel('fraction of population that is...')
ax.set_ylim([0.0, 1.0])
plt.plot(ts, er_sss, 'y', label='susceptible')
plt.plot(ts, er_iis, 'r', label='infected')
plt.plot(ts, er_rrs, 'g', label='removed')
plt.legend(loc = 'upper right')
which yields:
Note
If, instead of sub-classing epydemic.SIR, we simply used
the base class, epydemic.Monitor would only be able to
monitor the loci used by the base class (which are
epydemic.SIR.SI and epydemic.SIR.INFECTED as needed
by the dynamics). Since we want to keep track of all the
compartments, we have to record them.
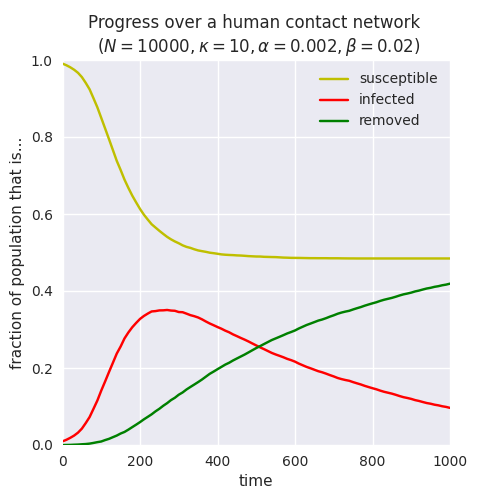
Of course we can also run the same monitored epidemic over a network with different parameters – or even over a network with a completely different topology, such as a powerlaw-with-cutoff that better models human contact networks: